


This guide was created to help with your online business foundations. We want to help you get your revenue, your time, and your focus dialed in!
Since starting the Wandering Aimfully, even back in the days when it was called BuyMyFuture/BuyOurFuture, we’ve had so many people reach out asking for advice about how to reach their business and life goals. While we’ve offered individualized advice to many over the years, we have noticed some overall themes that pop up time and time again.
Questions like:
- How do I know what to focus on to grow my business?…
- I know what I need to do but I struggle to find the time to improve my business…
- I make a bit of income here and there but I never seem to reach that point of financial security and freedom…
Our remedies for these common challenges most often boil down to the most foundational parts of running a business. Namely…
- Knowing and tracking your income by revenue stream (we know some of you out there right now are just guessing!)
- Tracking your living and business expenses (and streamlining them regularly!)
- Understanding where you’re spending your time, both in a macro sense (what aspects of your business in general do you devote the most time to) and in the micro sense (where do you spend each minute of your day?)
- Scheduling your week so you prioritize what you keep saying you want to accomplish
- Having a clear system of evaluating your revenue streams so you know what the most effective use of your time and energy is based on your goals
- Coming up with a clear plan and timeline for executing your growth strategies
So many of these things are things you already know—they’re things you feel should be in place for your life and business already—yet sometimes the simplest things are the hardest to pay attention to.
Sometimes the simplest things are the hardest to pay attention to.
Let’s face it: Finances are scary, productivity isn’t sexy, and choosing one focus is uncomfortable, especially for multi-passionate and creative people like those in the Wandering Aimfully community.
But believe us, getting clear on these things is the only way to make sure your business is built on a solid, sustainable foundation going forward.
That’s why we’ve created a four-phase roadmap to help you strengthen the foundation of your business.
We want you to use this as motivation to finally get these foundational pieces in the right place to gain more clarity and focus.
So, it’s back to basics we go!
WHAT TO EXPECT
Here’s an outline of what we’ll work through together:
- Phase 1: Know Your Numbers (Tracking your revenue and expenses)
- Phase 2: Where Does Your Time Go? (Tracking your time, productivity and scheduling)
- Phase 3: Evaluating Revenue Streams (Understanding input vs. output for each project or revenue stream)
- Phase 4: Choosing Your Focus (Deciding which aspect of your business to make your primary focus and writing an action plan for the next three months)
*Proud Moment Alert:* These Wandering Aimfully Members have been through Back To Business Basics! Prepare to scroll… 😉

Alright, with the WAIM community awesomeness out of the way, let’s get these business basics ducks in a row! To get this party started, it’s onto Phase 1: Know Your Numbers!

Phase 1:
Know Your Numbers
We believe there’s a lot more to personal success and happiness than just money. However, as with everything, there has to be a balance.
More money in your business can bring you freedom and flexibility in your life, which are things that can dramatically increase your happiness. Yet, it’s staggering to us how many people we give advice to that don’t have a system for tracking their finances—personally or professionally.
If you’re reading this right now with this face on 😬 because you know you’re one of those people, that’s okay! This program is your chance to change that!
We’re going to break down your numbers into two categories: Revenue and Expenses.
**It’s important to note, none of the methods we’re taking you through are meant to be 100% accurate to the penny. This is not an accounting class. (Thank goodness.) Instead, this is about common sense math and getting ballpark figures so you can make better decisions in your life and business. So try not to obsess over the small stuff and get caught in the weeds with the following exercises. Instead, keep your eye on the big picture and the general aim, which is to get an idea of how money is coming in, how much is going out, and how you can maximize the difference between those two.**
Part 1: Revenue
Here’s the first rule of business basics: You need to know how much money is coming into your business by revenue stream.
It’s not enough to see total numbers in your Stripe or Gumroad or PayPal or Shopify accounts, etc. Knowing what percentage of your overall business revenue is attributed to which projects/products/offerings is crucial for making shrewd decisions on what to put your focus and energy toward at any given time.
For example, if you’re spending 80% of your time on a revenue stream that’s only making you 20% of your income and you’re not seeing results, that’s helpful information so you can shift your focus to a product or project that’s going to get you a bigger bang for your buck.
Which brings us to your first action step:
Action Step:
Determine the monthly revenue for each of your revenue streams throughout the current year.
To do this, you can use a spreadsheet tool like Excel or Google Sheets, you can use our favorite database tool Airtable, or heck you can just write it down with pen and paper! Figure out the right process for you, but be sure to keep in mind your chosen process should be something you can continue to update going forward.
If you’re having trouble knowing where/how to start, fear not! We have some example spreadsheet templates you can use based on systems we’ve created for ourselves over the years (along with step-by-step details on how to use each below):
- For product-based businesses, try this Google Sheets template – Sales Revenue Dashboard
- For service-based businesses or service/product hybrids, try this Google Sheets template – Income by Project
- For #allthethings and any Airtable nerds, try this Airtable example base – Revenue Tracker
HOW TO USE SALES REVENUE DASHBOARD GOOGLE SHEET:
Step 1: Click on the link to the template and hit File > Make a copy… (this will allow you to edit the template.)

Step 2: Download your sales data (in CSV format) from your payment processors one month at a time. Here’s an example using data from Stripe. Under the Payments area, set your filter parameters and Export your data.

Step 3: Import your CSV into your Sales Dashboard spreadsheet as a new tab/sheet by going to File > Import… You can import as a new tab or you can replace the “January 2018” tab in the template.

Step 4: Sort your transactions so you can group by product or revenue stream. For example, in my case I sort by the “description” column because that would group transactions for the same course together. (To do this, go to Data > Sort Range…, make sure “Data has header row” is selected and choose the column to sort by.)


Step 5: Now that all your transactions for the same product are grouped together, I find that it’s helpful to color code each product. For example, in this image I highlighted Acrylic Explorations online course in green, Better Lettering Course in light coral, and Your First E-Course in medium coral. Then, insert a row at the bottom of each product section and sum up the revenue total for that product. (I find it helpful to highlight all these subtotals in a bright color like yellow.).

Once you’ve summed the subtotal for each product, you will likely also want to add up those subtotals to get your overall sales for the month

Step 6: Add your subtotals to the main yearly dashboard tab. (Tip: If you click into a cell and type “=” you can click over to your monthly sales data tab to select the cell with the subtotal for your product for that month OR you can just type the value in, you choose!)

Repeat this for every month. This should allow you to see on the Sales Dashboard tab about how much each of your products brought in each month of the year thus far. Here’s a look at my former business, Made Vibrant, and my own sales dashboard from 2016!

Here’s a walkthrough video just for you on exactly how to use this Sales Dashboard template step-by-step:
HOW TO USE INCOME BY PROJECT GOOGLE SHEET:
Step 1: Click on the link to the template and hit File > Make a copy… (this will allow you to edit the template.)
Step 2: Begin updating the spreadsheet with your client projects. List each client project in the top “Client” section. For each client row, you can color in the corresponding cells for the amount of weeks you spent working on the project. This method is especially helpful on an ongoing basis so you can see how many projects you’re working on at one time and your cashflow of when to expect each invoice coming in.
![]()
Step 3: Input each of your client invoices, entering the totals in the row of the corresponding client and the column of the corresponding week.
![]()
Step 4: The sheet should use formulas to automatically add up the invoice totals for each month from each client so you can see how much you made in total client/project income for each month.
![]()
Step 5: If you also have digital products or other income in addition to your client work, you can use the “Product” section in the bottom section of the spreadsheet to input those monthly totals.
![]()
Once you have all your various income and projects inputted, you should be able to see how much you’ve made by month, by project/product, and what percentage of your income has come from client work vs. products.
![]()
Here’s a walkthrough video just for you on exactly how to use this Income by Projects template step-by-step:
HOW TO USE REVENUE TRACKER AIRTABLE:
Step 1: Click this link to view the template Airtable base.
Step 2: Click “Copy base” in the top right corner. If you’re already an Airtable user, sign in to see your copied base. If you’re not, sign up! (You can also use our Airtable referral code if you want, we get a $10 kickback if you decide you like it and sign up!) This will now allow you to take our template and make your own edits.

Step 3: We believe Airtable is so versatile and flexible that you can use it for both client revenue and product revenue. But first let’s start by adding your client revenue. You’ll want to do that under the “All Payments” tab. Create a new row or “record” (as Airtable calls them) for each invoice or payment you’ve collected this year. Fill out the date of the invoice, description, amount, along with the name of the client underneath the “Revenue Stream” column. (You can just type the client name and hit enter which will create a new client from the dropdown meaning you will be able to attribute any additional invoices/rows to the same client.)
![]()
Now here’s the cool part. The way we have the Airtable setup, there’s also a “Monthly Summary” tab which aggregates all the revenue for a given month. However, we need to tell that summary tab which records (rows) to add up under each month. The next step is how we do that!
Step 4: For each client invoice record, copy the client name under the “Revenue Stream” column and paste it in the “Log” column that corresponds to the month it was paid.
![]()
These log columns are linked to the Monthly Summary tab, so by doing this step, you’re effectively telling Airtable to attribute that amount for that particular client under that particular month. Once you paste the client name under the appropriate log, the amount pops up in the Monthly Summary tab. Watch it in action:

Notice that because my third invoice was paid in February, I pasted the name of that client under the “February Log” column so it would show up in the February column over on the Monthly Summary.
Do this for every client invoice record, and then under the Monthly Summary tab, you can find your monthly totals in these summations at the bottom of your view.
![]()
The base also has a Total column that adds up the invoices for one client across every month. This allows you to see how much money total each client brought in for the whole year, and then the summation is how you know how much you made in TOTAL across the year.
![]()
Now what about if you have products too? We can track that revenue right here in the same sheet!
Step 5: Download your sales data from your payment processor one month at a time. In this example, I’m filtering my payments in Stripe to export payments made in January that were successful.
Step 6: Import the raw data from your CSV into a new tab on your Airtable. Click the + button and select “Import a spreadsheet.”
![]()
Step 7: Now, format your raw data! The import shows us the messy raw data of our product sales, with each row showing one transaction, but we need this data formatted to match perfectly with our “All Payments” tab setup.
To do this, we’ll need the first three columns to be Date, Description, and Amount…in that order.
*One important thing to note about Airtable: the first column is your Primary Field and is locked, meaning you can’t just drag and drop to rearrange like you can the other columns.
If your primary column is not your transaction date (mine is actually my Description in the example below), you’ll first want to copy that column, add a new column, and then paste that data like I did here. Then you’ll copy your date data and paste that over the primary column. Finally, just drag and drop the amount column so you’re left with the correct order Date, Description, Amount. If that was confusing, see it in action here:
![]()
Now you’ll also want to select the correct Field Types for the Date and Currency columns. To do that, double-click on the column header and select each corresponding field type: Date and Currency.
![]()
Yay! Our data is now correctly formatted.
Step 8: Now, copy/paste your first three columns of correctly formatted sales data into the All Payments tab.
![]()
As a reminder, each record or row represents a payment made to your business. So where in the context of clients each row was a paid invoice, now in the context of products, each row is a sales transactions.
Now we need to assign a revenue stream, but to make that easy, let’s group our transactions so that transactions from the same product are grouped together.
Step 9: Sort all your payments by “Description.” Choose Sort at the top of your tab, then from the dropdown select sort by “Description” and hit Apply.
![]()
This basically alphabetizes your transactions by description, which allows us to easy fill in the Revenue Stream column with the product name.
Step 10: Fill in the Revenue Stream column for each transaction with the product name. (You should be able to tell based on the Description text.) You only need to type it once, then you can drag the bottom right corner down to auto fill the rest of the rows for that product.
![]()
Step 11: Now we need to “log” each sale in the correct month so it will rollup in our Monthly Summary tab. As you remember from the steps above, just copy the Revenue Stream column and paste in the correct “Log” column. If you exported your sales data one month at a time, this will make things especially easy because you can just select every cell in the Revenue Stream column that corresponds to a January transaction and paste it in the January Log column.
![]()
Here’s a walkthrough video just for you on exactly how to use this Revenue Tracker Airtable Base step-by-step:
Part 2: Expenses
Hopefully, by now you have an idea of how much money your business efforts are bringing in and exactly how much each of your clients/revenue streams/products are contributing to your bottom line. But money coming in is only one part of the equation. We also need to understand how much money is going OUT.
That doesn’t just go for your business, that goes for your life as well.
Do you know exactly how much it costs you to live? Do you know how much you spend on shopping or eating out or entertainment each month?
This is where tracking your expenses and categorizing them comes in handy.
In our experience, so many people avoid looking at their spending habits because of the shame they feel about how much money they spend. Whether it’s because you’re in debt, or you’re making less than you want to be making, you might be avoiding your bank accounts to avoid these kinds of feelings.
But, the important thing to realize is that ignoring your finances doesn’t make them go away. The only way to stop that cycle of shame is to confront your habits and make changes to start spending smarter.
This was one of the very first things we did when we were trying to claw ourselves out of debt, and it was a crucial step for us in taking back control of our finances.
Not to mention, for every dollar less you spend in your life and business, that’s one more dollar of profit you get to keep and save or pay off debt with.
Action Step:
Track and categorize your expenses for the past three months using our ETAC exercise.
What’s ETAC you ask? ETAC stands for Expense Tracking And Categorization, an exercise we developed after being dissatisfied with the budgeting software we experimented with out there. We wanted a completely custom way to track our expenses and group them into categories, so we created our own method. (Jason also loves that the acronym sounds like the word attack, which is appropriate since we used this method to attack our mountain of debt.)
Just like in the revenue section, we’ll walk you through how to categorize your expenses using both Google Sheets and Airtable.
- Download Template: Expense Tracking and Categorization (ETAC) using Google Sheets
- Download Template: Expense Tracking and Categorization (ETAC) using Airtable
HOW TO USE THE ETAC SPREADSHEET USING GOOGLE SHEETS:
Step 0: Make a copy of the Expense Tracking and Categorization (ETAC) Google Sheets for yourself (File > Make a copy).
Step 1: Download the data from all your accounts and credit cards for the past three FULL months as CSVs. (CSVs might also be titled “comma delimited tabs” in your account download options.)
Step 2: Import your CSVs as individual tabs into the ETAC spreadsheet. (To do this, go to File > Import > Upload your CSV and select “Insert new sheet” under the import options)
![]()
Step 3: Format your data so it’s all uniform. Make sure you have three columns in this order: Date, description, and then amount. Be sure to format the date column as a date and format the amount column as a currency.
NOTE: I like to keep all expenses as negative numbers. Make sure it’s consistently negative OR positive across every debit or credit account you have because if not, your transactions may cancel each other out giving you an inaccurate total. Whether it was paid for on a credit card or with a debit card, if it was an expense (money going out) I make sure it’s formatted as a negative number.
![]()
Also, delete any transfers or credit card payments. We’re just looking for how much money went out the door, not how much was moved around between accounts. It’s REALLY important you remove these across every tab or else, again, your totals will cancel out and be substantially off.
![]()
Step 4: Once the data in all of your tabs is formatted uniformly, copy/paste each list of transactions into one sheet, the sheet in this spreadsheet labeled “All Transactions.”
![]()
Step 5: When every transaction has been pasted over to the All Transactions tab, sort by date and then fill out the appropriate “Month” column.
(This will make it easier to filter your data and see transactions by month.)
![]()
![]()
Step 6: Once months have been applied, go through every transaction line by line and assign a category in the category column.
You can use the category names already listed out on the Monthly Comparison sheet OR you can create your own.
![]()
Step 7: Now it’s time to add up your monthly totals by category and add to the Monthly Comparison tab. To get all the transactions in a certain month in a certain category, first Filter by one month, and then sort by category.
To do this, go to Data > Create a filter… and select the down arrow on the month column to check off which month you want to view at a given time. We recommend only viewing one month at a time when you’re adding up your category totals. Once you have just one month’s transactions in your view, then select the down arrow on the category column and hit Sort.
![]()
This will show you transactions in the same month AND group transactions in the same category together. This will make it easier to sum your totals over on the monthly comparison sheet.
Step 8: Now that you have transactions for one month only, grouped by category, you can head over to the Monthly Comparison sheet, and use the SUM formula to add up the total for each category within that month.
![]()
![]()
Also notice this will start to adjust your monthly expense totals, your three-month average, and your category average.
You can add more categories or more months to your Monthly Comparison tab, just be sure that you update the total formulas so they include those.
Step 9: Repeat these steps until you have the total amount spent for every category and every month.
Here’s a walkthrough video just for you on exactly how to use this ETAC Google Sheets template step-by-step:
HOW TO USE THE ETAC AIRTABLE BASE:
Step 0: Make sure you’re viewing the Expense Tracking and Categorization (ETAC) using Airtable.
Step 1: Download the data from all your accounts and credit cards for the past three FULL months as CSVs. (CSVs might also be titled “comma delimited tabs” in your account download options)
Step 2: Import your CSVs as individual tabs into the ETAC Airtable Base. (To do this, click on the + icon by the tabs and select “Import a spreadsheet”).
![]()
Step 3: Now we need to format your transaction data so it’s all uniform. You want to have three columns in this order: Date, description, then amount.
Be sure to double click on the date column and make the field type “Date” and double-click the amount column to make the field type “Currency.”
![]()
NOTE: I like to keep all expenses as negative numbers. Make sure it’s consistently negative OR positive across every debit or credit account you have because if not, your transactions may cancel each other out giving you an inaccurate total. Whether it was paid for on a credit card or with a debit card, if it was an expense (money going out) I make sure it’s formatted as a negative number.
Also, delete any transfers or credit card payments. We’re just looking for how much money went out the door, not how much was moved around between accounts. It’s REALLY important you remove these across every tab or else, again, your totals will cancel out and be substantially off.
![]()
Step 4: Once your data is all formatted uniformly, copy/paste each list of transactions into the Expense Tracking tab under the All Expenses view.
![]()
Step 5: When every transaction has been pasted over to the Expense Tracking tab, sort by date and then fill out the appropriate “Month” column. (This will make it easier to filter your data and see transactions by month.)
![]()
Step 6: Once months have been applied, go through every transaction line by line and assign a category in the category column.
You can use the category names already listed out on the Expense Summary tab OR you can create your own.
![]()
Step 7: Here’s where the magic happens! In order to pull in the total spent on a given category in a given month, we need to “log” our expenses in the corresponding monthly log column. To make this easy, go ahead and filter all your transactions by one single month.
![]()
Then, copy the category column for that month, and paste it in the corresponding monthly log column. In this case, we’ve filtered only July transactions, so we copy the category names and paste them in the July Transactions column.
![]()
The “July Transactions” field is linked to the Expense Summary tab, so if you go to the Expense Summary, you’ll now see the total spent on each category in the July column.
![]()
Step 8: Repeat this for each month of data. Filter by month, then copy/paste the categories into the log column matching that month.
Finally, you’ll be able to see your total spent each month by category. You can also use the summation bar at the bottom to see how much total you spent on a given month.
![]()
There are a few more fields on the Expense Summary tab you might find interesting.
- Budget: Fill out this field with your budget for each category.
- Monthly Average: This formula will average however many months you’d like to find out your average expenditure for that category. **Be sure to edit this formula and only include the months which have data or else the $0 months will drag down the average.
- Over/Under: This tells you whether your average is over or under the budget you’ve set.
- Alert: This simply updates with a 😎 or a 😬 depending on whether you’re over or under budget.
- Total per category: Shows you how much you’ve spent in total for that category. might be especially helpful for more yearly categories like Travel.
- Current Month Difference: You can update this formula with the current month and it will tell you how much you have left in your budget for that month.
- Current Over/Under: Tells you if your over or under budget based on the Current Month Difference formula.
Here’s a walkthrough video just for you on exactly how to use this ETAC Airtable base step-by-step:
Summary: Questions & Action Steps
As a recap, here’s what you should have used the steps above to do for this lesson:
- Track your revenue for the current year using one of the three methods outlined above
- Track your expenses for at least the past three full months using the methods outlined above
Now here are some critical questions to ask yourself as you take a look at the data:
Revenue:
- What revenue stream or product brought you the most revenue this year for the least amount of effort?
- What revenue stream or product brought you the least amount of revenue this year for the most amount of effort?
Expenses:
- Did you spend more or less every month than you expected in your head?
- List three categories that you know you could cut back in to spend less every month. (Bonus: Go through every category of expenses and look for ways that you could streamline your expenses.)
- What will be your budget for each category going forward?
Once you get your numbers in order, come back next week for Phase 2, all about where you’re spending your time and how you’re maximizing your productivity!

Phase 2:
Where Does Your Time Go?
It’s time for phase two of Back To Business Basics, let’s not waste a single second! Alright fine, we’ll stop with the silly time puns. We won’t, however, sugar coat how important it is that you start to manage your time like we showed you how to manage your money: By actually looking at where your time goes!
Similar to phase one (Know Your Numbers) we want to show you how we’ve been able to find more hours in our days by examining where we’re actually spending our minutes and hours (just like where you’re spending your dollars). There are two exercises in this section: The first is a more hands-on Time Tracking Journal that will help show you where every hour of your day is actually going. The second includes two apps you’ll install on your computer and phone which will track your daily habits and show you where your time goes.
There is not a doubt in our minds that you can make some drastic changes in how you manage your time in just a few short days. They key is that you need to understand where you’re currently spending your time and not try to fix everything overnight.
If we can help you gain one hour back each day, you’ll have an extra 30 hours in the next month that you didn’t have before!
Time Tracking Exercise #1: Time Tracking Journal
We have two time tracking exercises for you to do and while each is important on its own, we would HIGHLY recommend doing both (you can do Exercise #2 alongside #1 with almost no extra work!)
What is a Time Tracking Journal? Quite simply, it’s a log you keep of what you’re doing during every hour of the day.
The point of keeping a Time Tracking Journal is to see if your mental time accounting matches your reality. We know what it’s like to think: “Where did the day go? What the heck did I do all day?” By keeping a written log of what you’re doing each hour of the day you can see exactly where your time is going and you can be honest about changes that need to be made in your daily life.
Action Step:
Understand how you’re spending every hour of your day and find ways to improve your habits and become more productive.
There are three ways we recommend setting up a Time Tracking Journal and we’re going to let you play a bit of Choose Your Own Adventure here. Because we know you’re an action-taking person and already did Phase One (Know Your Numbers) we’re going to assume you can create your own Time Tracking Journal in one of three ways:
- Google Sheets: Very straightforward, just enter in what you did for every 30-minute block of time.
- Airtable: Same as Google Sheets, just using Airtable instead.
- Pen and Paper: Same 30-minute blocks, except you physically write them down in an actual journal (ooooh, ahhhhh!)
IMPORTANT: We recommend keeping a Time Tracking Journal for at least three days straight. We promise it will not derail your entire life and if you want to track your time for more than three days, feel free to do that.
Because our Time Tracking Journal is exactly the same whether you use Google Sheets, Airtable, or pen and paper, we’re not going to walk-through each one. This should be a very simple exercise to keep up with and we’ll share the step-by-step process using Google Sheets as our example…
HOW TO USE A TIME TRACKING JOURNAL
Step 1: Commit. Commit to yourself and to this simple exercise. YOU GOT THIS!
Step 2: Set a recurring hourly alarm or timer on your phone or calendar. You’ve probably never tracked your time on an hourly basis, so make it easy on yourself and have some sort of reminder that pops up each hour telling you to record where you’ve been spending your time.
Step 3: Track your time via 30-minute blocks in two ways.
What Where You Working On? The first column you want to track is the bigger task or project you were working on (example shown in image: “Wrote sales page copy for my Branding Course”).
![]()
What Else Did You Do? The second column you want to fill out is if you spent time on social media, checking email, etc (example shown in image: “Listened to Armchair Expert podcast and checked Instagram”).
![]()
Step 4: Track all your time spent throughout the day! Do not wait until the end of the day to go back and fill out your Time Tracking Journal. You won’t remember exactly what you worked on and you’ll continue in the cycle of not knowing where your time has gone.
Step 5: At the end of each day, review where you spent your time. Fill out the final column (Could This Be Improved?) with a YES if it could. How many hours could you improve? How many hours could you apply toward more productive things knowing how you actually spend your time?
![]()
Step 6: At the end of the three days (minimum) identify what small changes you can make in your daily life to get more time and focus back for what matters.
- Instead of checking email and social media sites all day long, could you instead only check them 2-4 times throughout the day at set times (8am, Noon, 4pm)?
- Instead of trying to work on your side project at night, should you try to work on it first thing in the morning or at lunch?
- Instead of doing “adulting” every day of the week, should you try to move all your errands/personal stuff to one or two days of the week so it doesn’t cut into work time?
Note: The idea for tracking your time is NOT to optimize your days to have as many work hours as possible. The idea is to make sure you see where your time is going and to ensure you’re not letting time slip through the cracks and that you’re allocating time where YOU want to be spending it to reach your life and business goals.
Time Tracking Exercise #2: Install the RescueTime and Moment apps (they’re free!)
As we mentioned in Exercise #1, we recommend using RescueTime and Moment alongside keeping a Time Tracking Journal. Using the RescueTime and Moment apps are a completely passive way of tracking where you’re spending your time and attention when using your computer or phone. Does it sound like the results might be scary for you? GOOD! We want you to confront your habits and how you’re currently spending your hours otherwise you’ll continue to do what you’ve always done (just like taking a look at your expenses and revenue does for your money!)
What is RescueTime? It’s a free app that you install on your computer that tracks how much time you spend surfing the web, using certain apps, browsing Facebook, etc.
What is Moment? Similar to RescueTime, except it tracks your time on your phone (iOS only, Android options below).
*We are not being paid to endorse RescueTime or Moment, we simply believe they’re awesome tools that can show you some really interesting data about how you spend your time.
Action Step:
Determine where the percentage of your time is going for your business and life, and identify your ideal time split.
The wonderful part about the Action Step for Exercise #2 is that RescueTime and Moment are going to do all the work for you (and with nice charts and graphs)!
HOW TO USE RESCUETIME
Step 1: Sign up for a completely free RescueTime account here.
Step 2: Install the RescueTime app on your computer.
Step 3: Let RescueTime do its thing! That’s it. You’ve done all the steps to get RescueTime installed.
Step 4: View your Daily Dashboard in your RescueTime account after your first full day of having it installed. What do you notice? What stands out to you? What do you need to change about how you spend your time on your computer?

Step 5: Once you’ve had RescueTime installed for a week, you’ll get emailed a nice report. What can you learn from your weekly habits that you need to change?

HOW TO USE MOMENT
Step 1: Download the app for iOS (for Android checkout App Usage or Quality Time).

Step 2: Say “Yes” or “Okay” to all the steps when you first launch the Moment app. Let it track your time and your location to give you the most accurate time tracking data.
Step 3: Let Moment do its thing! Yep… that’s all you need to do.
Step 4: After a full day of having Moment installed, review your screen time habits. Are you surprised by where you spent your time on your phone? Maybe a bit shocked? What do you need to change? Remember, you don’t have to go cold-turkey, but small changes to your daily usage can go a long way in giving you more time back to put towards other things.

*One thing that’s neat about RescueTime and Moment is that the paid versions of their products have ways to help you block certain activities. Let’s say you have a particularly hard time not being on Facebook, RescueTime and Moment’s paid versions (very cheap!) can help block Facebook for you for certain periods of time.
Summary: Questions & Action Steps
Recapping Phase Two, here’s what should accomplish by following the two exercises above:
- Create a Time Tracking Journal to track every hour of your day for at least 3 days in a row
- Install RescueTime and Moment to passively keep track of your computer/phone usage
Here are the questions to answer as you track your time and look at the data:
Time Tracking Journal:
- Where are you wasting the most time and how much time could you get back to apply to other things each day?
- What habit do you need to break that you know isn’t helping your life or your business?
- What habit do you want to put in place right now to get more time back?
RescueTime/Moment:
- What percentage of your time is currently going to your business?
- Is the percentage of time going toward your business being spent on the RIGHT things?
- What percentage of your day are you wasting that could be applied to better your life or business?
You WILL get more things done and become a more productive person if you take a look at how you’re spending your time each day. The most important part is to admit where you could be doing better and starting making small changes today.

Phase 3:
Evaluating Revenue Streams
Chances are you’ve asked yourself this age-old question as a business owner:
What area of my business should I focus on next?
Well, we’re going to try to help you answer that, but we do have to do a little bit more legwork to get there. Let’s recap what you’ve accomplished thus far.
In Phase One: Know Your Numbers, you should have ended up with a much clearer picture of the profitability of each of your projects or revenue streams.
In Phase Two: Where Does Your Time Go, you should have ended up with a few ways to make your days more intentional and productive.
Armed with deeper knowledge about the two most fundamental resources you have (money and time), it’s time to take a hard look at your revenue streams to understand the single greatest opportunity you have to move your business forward.
In this section, you’ll be evaluating the health of your revenue streams to identify the product or project with the greatest potential upside. We’ll also talk about how to know when it’s time to optimize what you already have going or create something entirely new.
Creating a revenue stream comparison chart
Before you can determine what revenue stream to focus your attention on, it helps to see everything side by side so you can make comparisons.
Action Step:
Fill out the revenue comparison chart with every product or revenue stream from your own business.

Click here to download this template as a PDF
Here’s how we recommend you complete this revenue comparison chart.
Step 1: Download the PDF above or create your own table with 4 columns, listing out your various revenue streams as rows in the first column.
If you have one broad revenue stream such as client work (if you’re a designer, for example) we recommend breaking that down even further into categories. For example: web design clients, logo design clients, etc. This will allow you to make more specific conclusions about what to focus on.
If you have various product offerings, write each one out on a separate line.
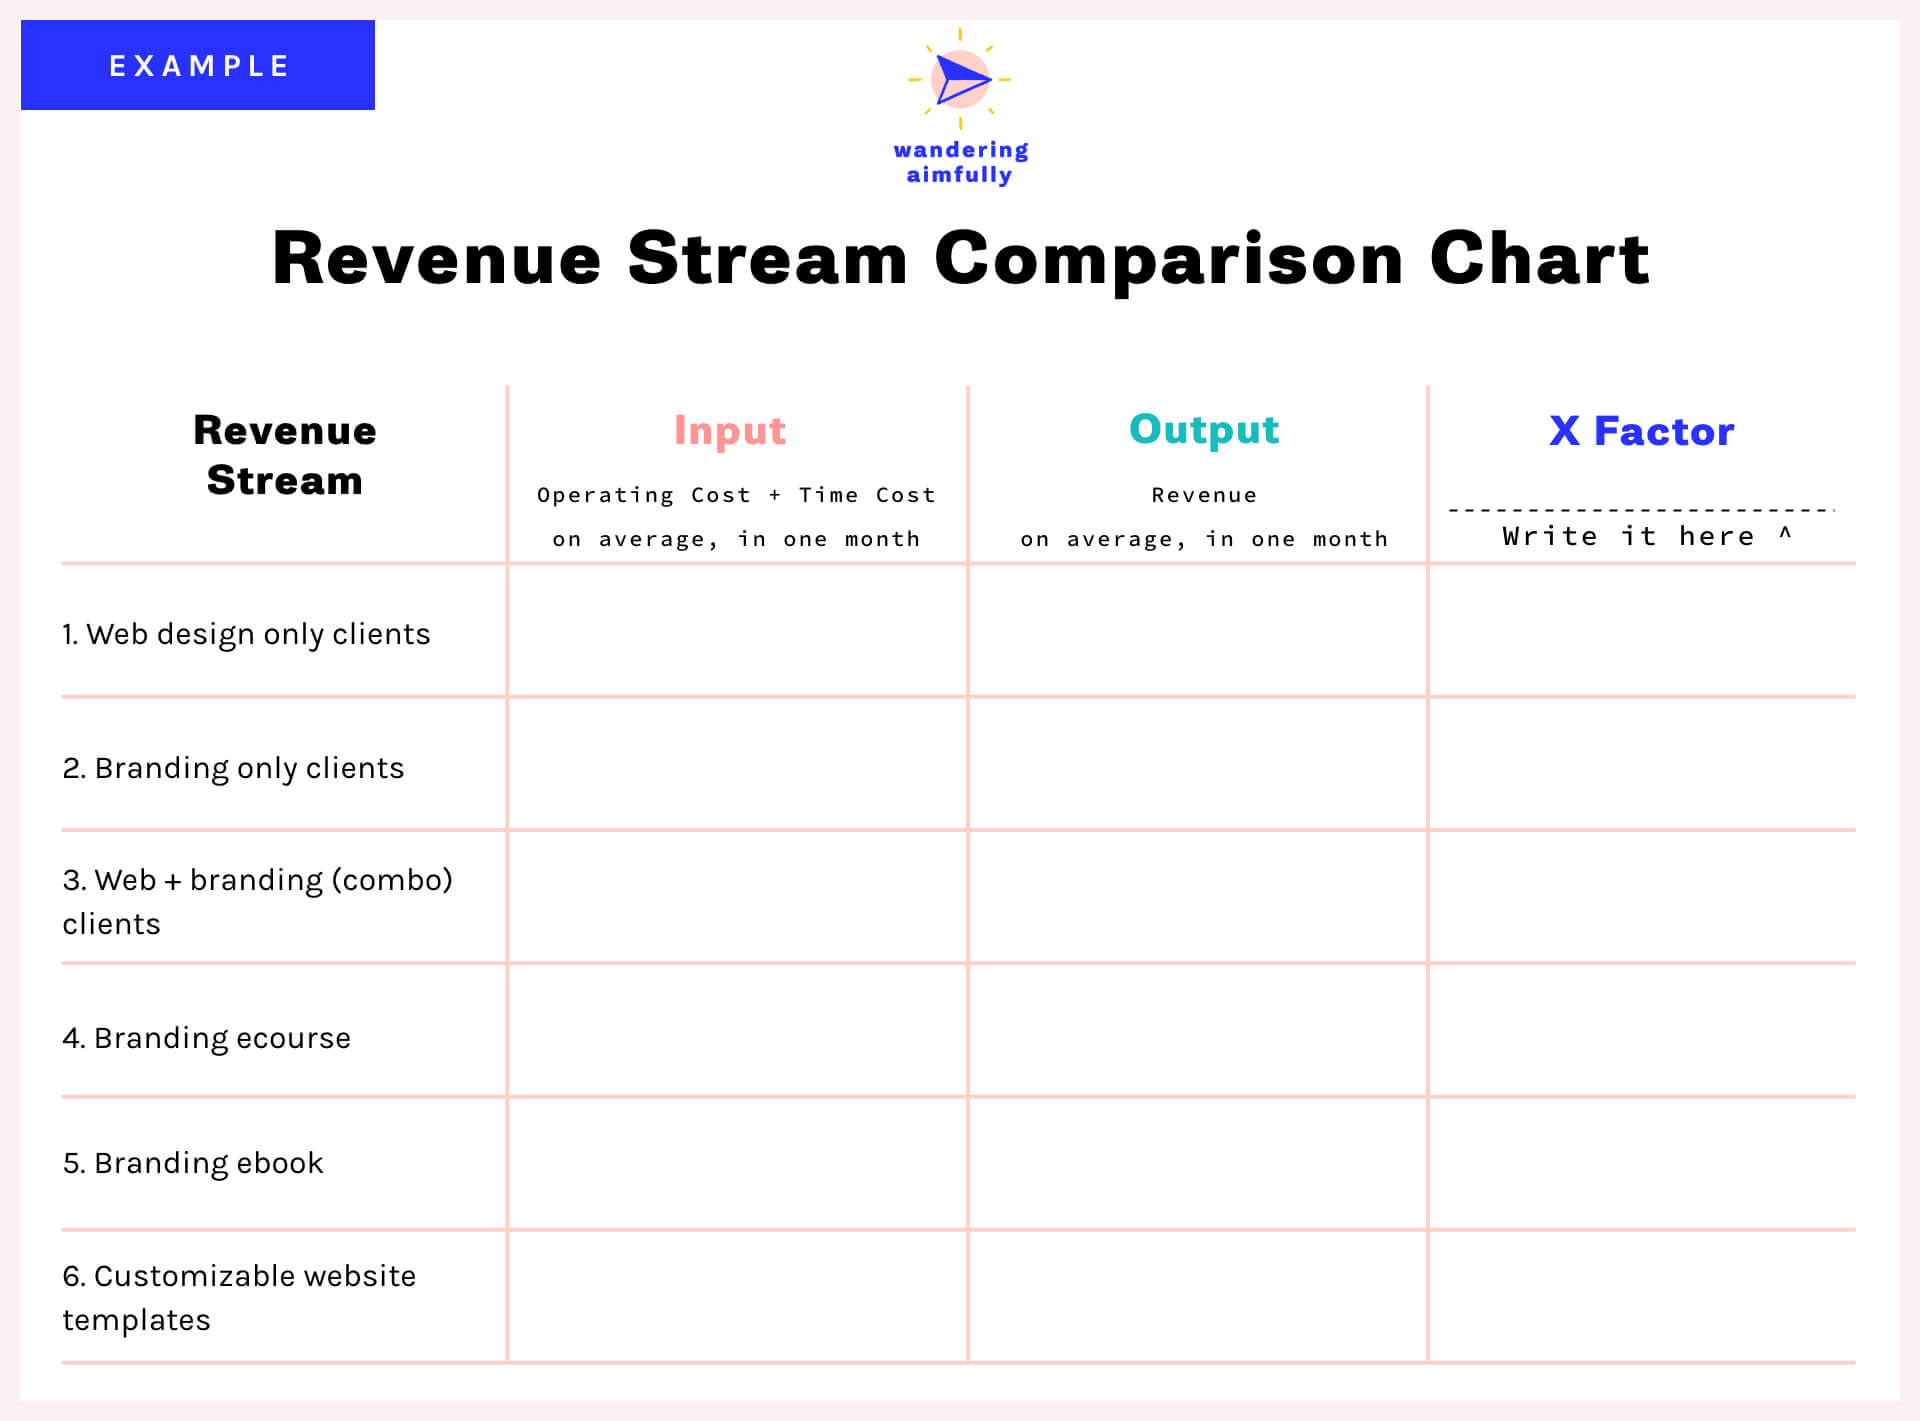
Step 2: For each revenue stream you’ve listed out, now write down the “input” in terms of money AND in terms of time it requires to operate that revenue stream.
Three things to note:
1. It helps to specify a timeframe for the input/output to make sure you’re comparing apples to apples. I recommend using one month. If that’s the case, you want to include how much operating cost you pour into that product or offering in a month’s time and how much time you contribute to it on a monthly basis. It may help to estimate your time by the week and then multiply by 4.
2. You may also want to assign a monetary value to your time in order to later compare it with that revenue stream’s output. For example, you could say your time is worth a flat $100/hour, so a revenue stream that takes 30 hours a month and $300 to run, would actually require $3,300 of input.
3. If you have general expenses that aren’t revenue stream specific, take that monthly total and divide it evenly among your various revenue streams so it’s a distributed cost.
4. As far as time goes, for products you want to think about ongoing input or operating input for the purposes of comparison, not necessarily the time it takes up front to create the product.

Step 3: Consult your revenue tracker from the Know Your Numbers section and use the totals to fill out the output column.
If you completed Phase One, then you should know how much on average you make in a month per revenue stream. If you didn’t already complete that exercise, be sure to sum up those totals and write them down in the output column.

Step 4: Now this last part is really crucial for the decision-making that will result from this comparison. Finally, use the fourth column as your “X factor”—aka one more comparison criteria that matters to you.
This X factor could be enjoyment (how much you like working on that revenue stream) or it could be alignment (how well it lines up with your personal values) or it could be something like “future vision” (how well it meshes with the vision of where you want to steer your brand.)
The point is, you get to choose. Write it down as the final column header and then write in a number between 1 and 10 for using that criteria for each one of your revenue streams.
That should complete your revenue comparison chart and it should look something like this:

Using the revenue stream comparison chart to make decisions
Now that you have all this information, it’s time to use it!
We want to use the comparison chart to look for the revenue stream with the greatest opportunity for impact. This means finding the revenue stream with the most efficient output to input ratio (ie. greatest output for the least input) but also with the highest X factor score.
Use an efficiency score to help you!
One way to do that is to divide the output column by the input column to come up with an “efficiency score.” This makes it super easy to see the stream with the greatest output for least input, because the score will be the highest number.

But, don’t forget, we have to also consider the X factor criteria. Your revenue stream with the highest efficiency score might actually be the one you enjoy the least, which isn’t necessarily the best thing to focus on going forward. Instead, look for revenue streams with relatively high efficiency scores AND high X factor scores.
For example, you can see “Branding only clients” and “Branding ecourse” in the example have a similar efficiency score BUT one of them has a much higher enjoyment score:

Using the example, now I’m able to see that out of all my various projects, the branding e-course is probably worth investing in and focusing on. While it may not be the source of greatest revenue (YET) it’s efficient at making money (meaning time poured into it will see a notable return) AND it’s something that I enjoy doing.
This is how you can use this comparison chart to choose what to focus on.
Keep in mind, you can make up your own rules too. Maybe instead of the efficiency score method, you want to choose the revenue stream that is making you the most money with the most enjoyment, and you don’t care how many hours or how much money it takes to operate. That’s okay. The idea is just to think critically about your various projects and make decisions based on real data, rather than simply feeling stuck or overwhelmed with no idea of what to focus on.
What about creating new revenue streams?
Now, you might be asking yourself, what if none of my current revenue streams are really working? Is it time to try creating something new?
The answer is maybe. But we always try to caution people about immediately jumping to the conclusion that it’s time to create something new. Why? Because it’s all too easy to get caught up in “shiny object syndrome.” The nature of creativity is that we get excited about projects in the beginning and once time goes on they begin to lose their luster.
Part of running a successful and profitable business is learning how to use your time and energy in the most efficient, impactful way possible. Creating something new often requires you to reinvent the wheel and while it may be exciting, it can be a drain on your resources. Instead, it’s advisable to find ways to fall back in love with your existing projects or find ways to breathe new life into those.
Summary: Questions & Action Steps
Recapping this phase, here’s what you should accomplish by following the steps above:
- Fill out the revenue comparison chart with every product or revenue stream from your own business and your own X factor criteria
Here are some questions to answer as you take a look at your revenue streams:
- Based on the data, what revenue stream do you feel has the greatest opportunity for impact in terms of moving your business forward?
- What are three ideas of things you could try in order to increase revenue for that particular revenue stream?
- If you spent the next three months investing time and focus into that one revenue stream, what’s a realistic goal for boosting the revenue of that one stream?
- Finally, did anything surprise you about the input of your various revenue streams? Using what you already learned from Phase One and Phase Two about your money and time resources, are there ways you could cut down on expenses or ways you could be more efficient with your time to improve the efficiency score of any of your revenue streams?

Phase 4:
Choosing A Focus And Making An Action Plan
Hopefully, by now, you’re starting to see a clear path forward on what to focus on next. If not, this final phase of Back To Business Basics is the time to make that decision and create a specific action plan moving forward.
It’s time to decide what revenue stream to focus on, what specific goal(s) you’re working toward, and come up with some clear tactics on how to get there.
Choosing a revenue stream to focus on
If you haven’t already, start by looking back at Phase Three and your revenue stream comparison chart to determine which revenue stream has the highest potential impact on your business. You can base this decision off the more analytical route we went over in Phase Three about checking your efficiency scores and comparing with your X factor.
If you’re still struggling after that, another thing we consider when choosing where to place our focus to move things forward is to look at everything we’re currently working on and identify what we call the Brick Walls and Cracked Doors.
“Brick Walls”
Brick Walls are what we call obstacles you repeatedly find yourself bumping up against over and over with one of your revenue streams.
Example Brick Wall: Let’s say you’re a designer and you constantly find yourself working more hours on projects than you estimated, meaning ultimately you’re getting paid less than you’re worth for the time you spend on client work. You’ve tried to optimize your process for estimating your time when you quote projects, but inevitably you find yourself logging overtime project after project.
Example Brick Wall Solution: It might be time to consider shifting your focus away from that revenue stream and trying something like digital products so you’re not trading time for money—something that consistently gives you headaches.
“Cracked Doors”
Cracked Doors, on the other hand, are what we call slivers of opportunity that present themselves or an area where you feel the momentum building in your business.
Maybe you have a particular blog post on a topic that’s really taking off an getting a lot of traction. Maybe you have a client who you’ve worked with a few times and they’ve floated the idea of paying you a monthly retainer. Maybe you have an influx of emails asking you if you offer a particular offering that’s not listed on your website. These are things to take note of and things that may not come through in the “data” of your comparison chart from Phase Three.
Note when it comes to Cracked Doors: Beware of shiny object syndrome! There’s a difference between spotting a smart opportunity for your business and just being bored of what you’re already doing so you’re craving something new. Part of being a shrewd business owner is being able to spot the difference. Creating something entirely new should actually be the last thing you prescribe your business for all the reasons outlined in the final section of Phase Three.
Now, with all these things considered, it’s time to pick your pony!
Action Step:
Using the revenue stream comparison chart to guide you, choose ONE single area of your business to make the primary focus for the next three months.
Clearly defining your three-month goal
Once you know WHAT to work on, it’s important to define what “working on it” is aiming to get you. We need to establish a goal. Yay goals!
Project out your next 3 months of revenue
Head back to your Revenue Tracker from Phase One and determine realistic revenue goals for the next three months. We like to measure our previous (actual) revenue against upcoming (projected) revenue multiple times throughout the year. Now is the perfect time to project your revenue by project or client for the next three months (feel free to add it right into your Revenue Tracker sheet or Airtable)
Write down any time-related changes you need to make going forward
You may also want to determine a time-related goal. Based on what you learned in Phase Two: What Do You Spend Your Time On, it’s not just about spending more hours working. It’s about spending the right hours doing the right work. It may make sense for you to write down how many hours a week you’re trying to keep these growth efforts constrained to, so you don’t just find yourself in a situation where you’re feeling burned out. Remember, this is also a way of keeping your input (your time cost) as low as you can, making your revenue stream as efficient as possible.
Is it time to create (or finish working on) a new revenue stream?
If you’ve gone through all phases of Back To Business Basics and believe now is the time to create a completely new revenue stream, now is a great time to schedule the production and estimate your revenue. A couple questions to answer that should help you:
- What is a realistic timeline to launch your new revenue stream?
- What needs to get done in the next few weeks/months (carve out time on your calendar!)
- Can you get pre-orders for your new revenue stream to prove your hypothesis that people want it?
- What is the smallest best version you can get launched as quickly as possible?
- What might you have to sacrifice in order to get your new revenue stream up and running?
- Once your revenue stream is launched, what will you do afterward to keep it selling consistently?
- Can you surprise and delight the first customers of your new revenue stream?
Creating your action plan
You know what to focus on, you know what you’re aiming for, but now it’s time to determine what exactly you’re going to do to improve your revenue and to create a clear action plan to make that happen.
Part of the overwhelm of being an entrepreneur is that there are an endless amount of things you can try or change when it comes to your business in order to improve it. To make these options more manageable, we break them down into three core categories: 1) Process; 2) Product; or 3) Promotion.
Here are some ideas of how to beef up your revenue stream by improving these three areas:
Product: Is your product/service everything your customers need or is it missing something?
To get the answers, consider getting feedback from existing customers by emailing them simple surveys with just a few questions (we love Typeform for surveys).
- What made them buy?
- What problem do they feel your product or service solves for them?
- What did they really enjoy about your product or service?
- What did they think could be improved?
Sending a survey via email is great, but don’t hesitate to hop on Skype to chat face-to-face. Some of the best feedback we’ve ever received for our businesses has come from actual conversations with existing or potential customers. Make sure you let them know you want honest, constructive feedback and then see if there are any recurring themes in that feedback.
Similarly, you may want to get feedback from people who don’t buy. For example, with our Wandering Aimfully membership, if someone clicked on our sales page and showed interest but didn’t buy, we email them a few days after launch and ask them to fill out a short survey. This allows us to see if there’s anything we’re missing in terms of what our membership offers or how we’re communicating it.
Promotion: Is there a disconnect between your product/service and your customers?
If you know your product solves a particular problem and its top-notch, it’s possible your problem lies with the promotion. Any of the following could be to blame for this disconnect:
- The wrong price point for the value you’re providing
- Not enough people know about your offering
- You’re not communicating the problem your offering solves clearly enough*
*We’re guilty of this one and we see it all the time. It’s human nature to focus on the features of what you sell in your sales copy, instead of what problem it solves for your customer (the benefits). The easiest way to figure out if you’re not communicating the problem is to refer back to survey results to the question you asked about this. You could also have someone else who has similar experience running an online business review your sales copy to see if it’s speaking to the features (wrong) or the benefits (right!)
And here are some potential solutions to your promotion problems:
- Adjust the price or add more value to your offering
- Find new audiences to tap into to promote your offering
- Adjust your website/sales page (or sales email) copy or experiment with ways to showcase the transformation your offering provides
Process: Is there a way to streamline your process or reduce expenses?
Finally, if your product is great and you feel you’re getting a steady influx of customers, it’s possible the improvements could lie in your process.
Does this revenue stream take up too much of your time? Are there parts of the process that could be smoother for your customer or for you?
For example, maybe you find with your clients that a lot of time is wasted on your first call together just getting an understanding of the project specifics. Could you develop an intake survey you could send via email that would give you background info to make your meetings more productive? Then you could have a first call that’s much more streamlined. Things like this may require a time investment up front but will make you more efficient over time.
Ultimately, you should have an understanding by this point of what processes might need fixing in your business (hint: many of them will have to do with time allocation and management). What have you seen after going through the first three phases of Back To Business Basics that need attention?
Action Step:
Using the ideas above (or your own), write down THREE improvements you plan to make to your chosen revenue stream in order to reach your three-month revenue goals. Bonus points if you want to share those with us via email for some extra accountability.
Conclusion
Making Your Plan Real
It’s not enough to just write a few tactics and a revenue goal down on paper. You have to find a way to really integrate this plan into your schedule and your existing workflow.
Remember, business is a complicated puzzle. There are so many moving parts, and you may not find immediate success or growth with the first thing you try. If you implement your chosen three improvements and don’t see the life you’d hoped for, experiment with three more. Succeeding with your business is about taking imperfect action, testing your assumptions, and utilizing your newfound focus.
If we can help on your journey, feel free to reach out to us!